Transient Survey
"JCMT Transient Survey" is one of the JCMT large programs (PI: Gregory Herczeg; Korean coordinator: Jeong-Eun Lee), monitoring nearby (> 500 pc) eight star forming regions at 450 & 850 µm with the SCUBA-2 (Submillimetre Common-User Bolometer Array 2) on the James Clerk Maxwell Telescope (JCMT).
The survey was begun in 2015 December and will continue the approximately monthly cadence monitoring observations until 2020 January. This firstly conducted submillimeter transient survey for nearby star forming regions, where ~180 protostars and ~800 disk sources are located, is optimized to study the accretion variability for deeply embedded protostars.
 Figure 1. A picture of the James Clerk Maxwell Telescope (JCMT)
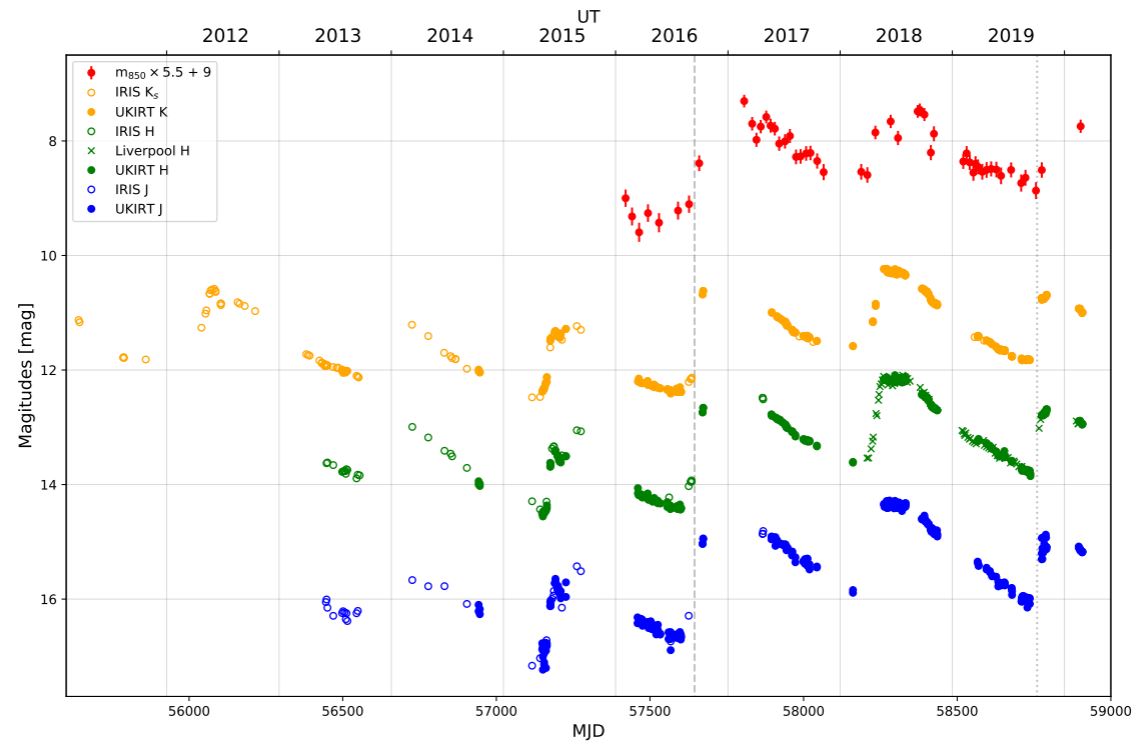 Figure 2. The time-magnitude plots at near-IR and 850 µm bands of EC 53 (
As a result of the survey, a submillimeter variability was detected for Class I protostar, EC 53, in the Serpens main (Yoo et al. 2017). At least by a factor of 1.5 magnitude of variability at 850 micron is reported. The periodicity of 543 days was identified from the previous K band observation (Hodapp et al. 2012). The follow-up observation at 450 & 850 µm and multi-wavelengths observations with various instruments are conducted (Lee et al. 2020, ApJ). The observed sub-millimeter variation has been explained by ~3.3 times of internal luminosity increase from the outburst (Baek et al. 2020) using radiative transfer modeling.
In 2021, we summarize the four-year survey results of the JCMT Transient Survey (Lee et al. 2021, ApJ). We apply the Lomb-Scargle Periodogram technique to search for the variabilities on 295 submillimeter peaks (Fmean > 10σ), including 22 disk sources (Class II), 83 protostars (Class 0/I), and 190 starless sources. We uncover 18 secular variables, which are all protostars, and classify them into three groups (Periodic, Curved, and Linear). Limiting our sample only for protostars, we find that 22% are observed as secular variables. The single-epoch burst, drop events and inherent stochastic sources are not observed. The detectable levels of our analysis are obtained by the analytical approach and the Monte-Carlo test (Figure 3).
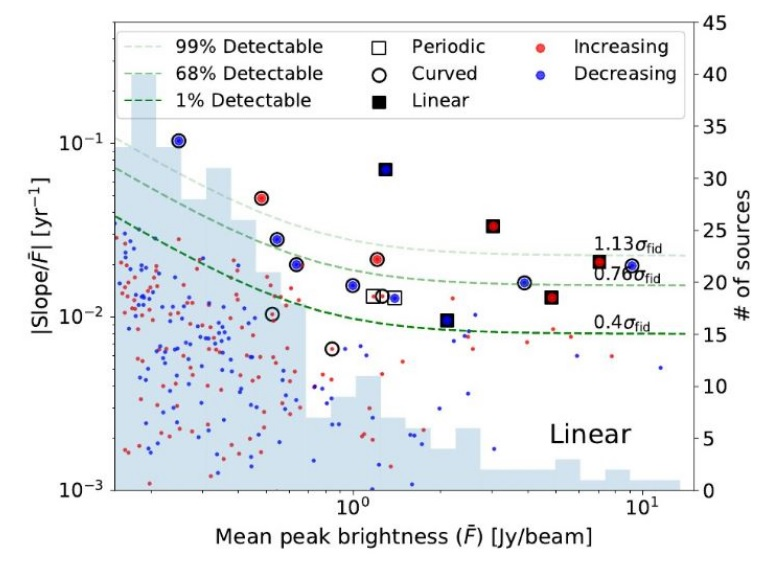 Figure 3. Scatter plot of fractional slope vs. mean peak brightness. Background: Histogram of the mean peak brightness for the entire submillimeter sources. Small marks indicate the sources of which linear variabilities are not shown. Three green lines indicate the 99%, 68%, and 1% detectable level from top. The corresponding values are noted above each line. The red and blue markers indicate the sources with the positive, and negative best-fit slopes. Empty circles and squares denote four sources which are only found by sinusoidal fitting.
